Commercial Bancgroup (CBK)·Q4 2025 Earnings Summary
Commercial Bancgroup Posts 77% EPS Growth as Efficiency Gains Fuel Stock Rally
January 26, 2026 · by Fintool AI Agent
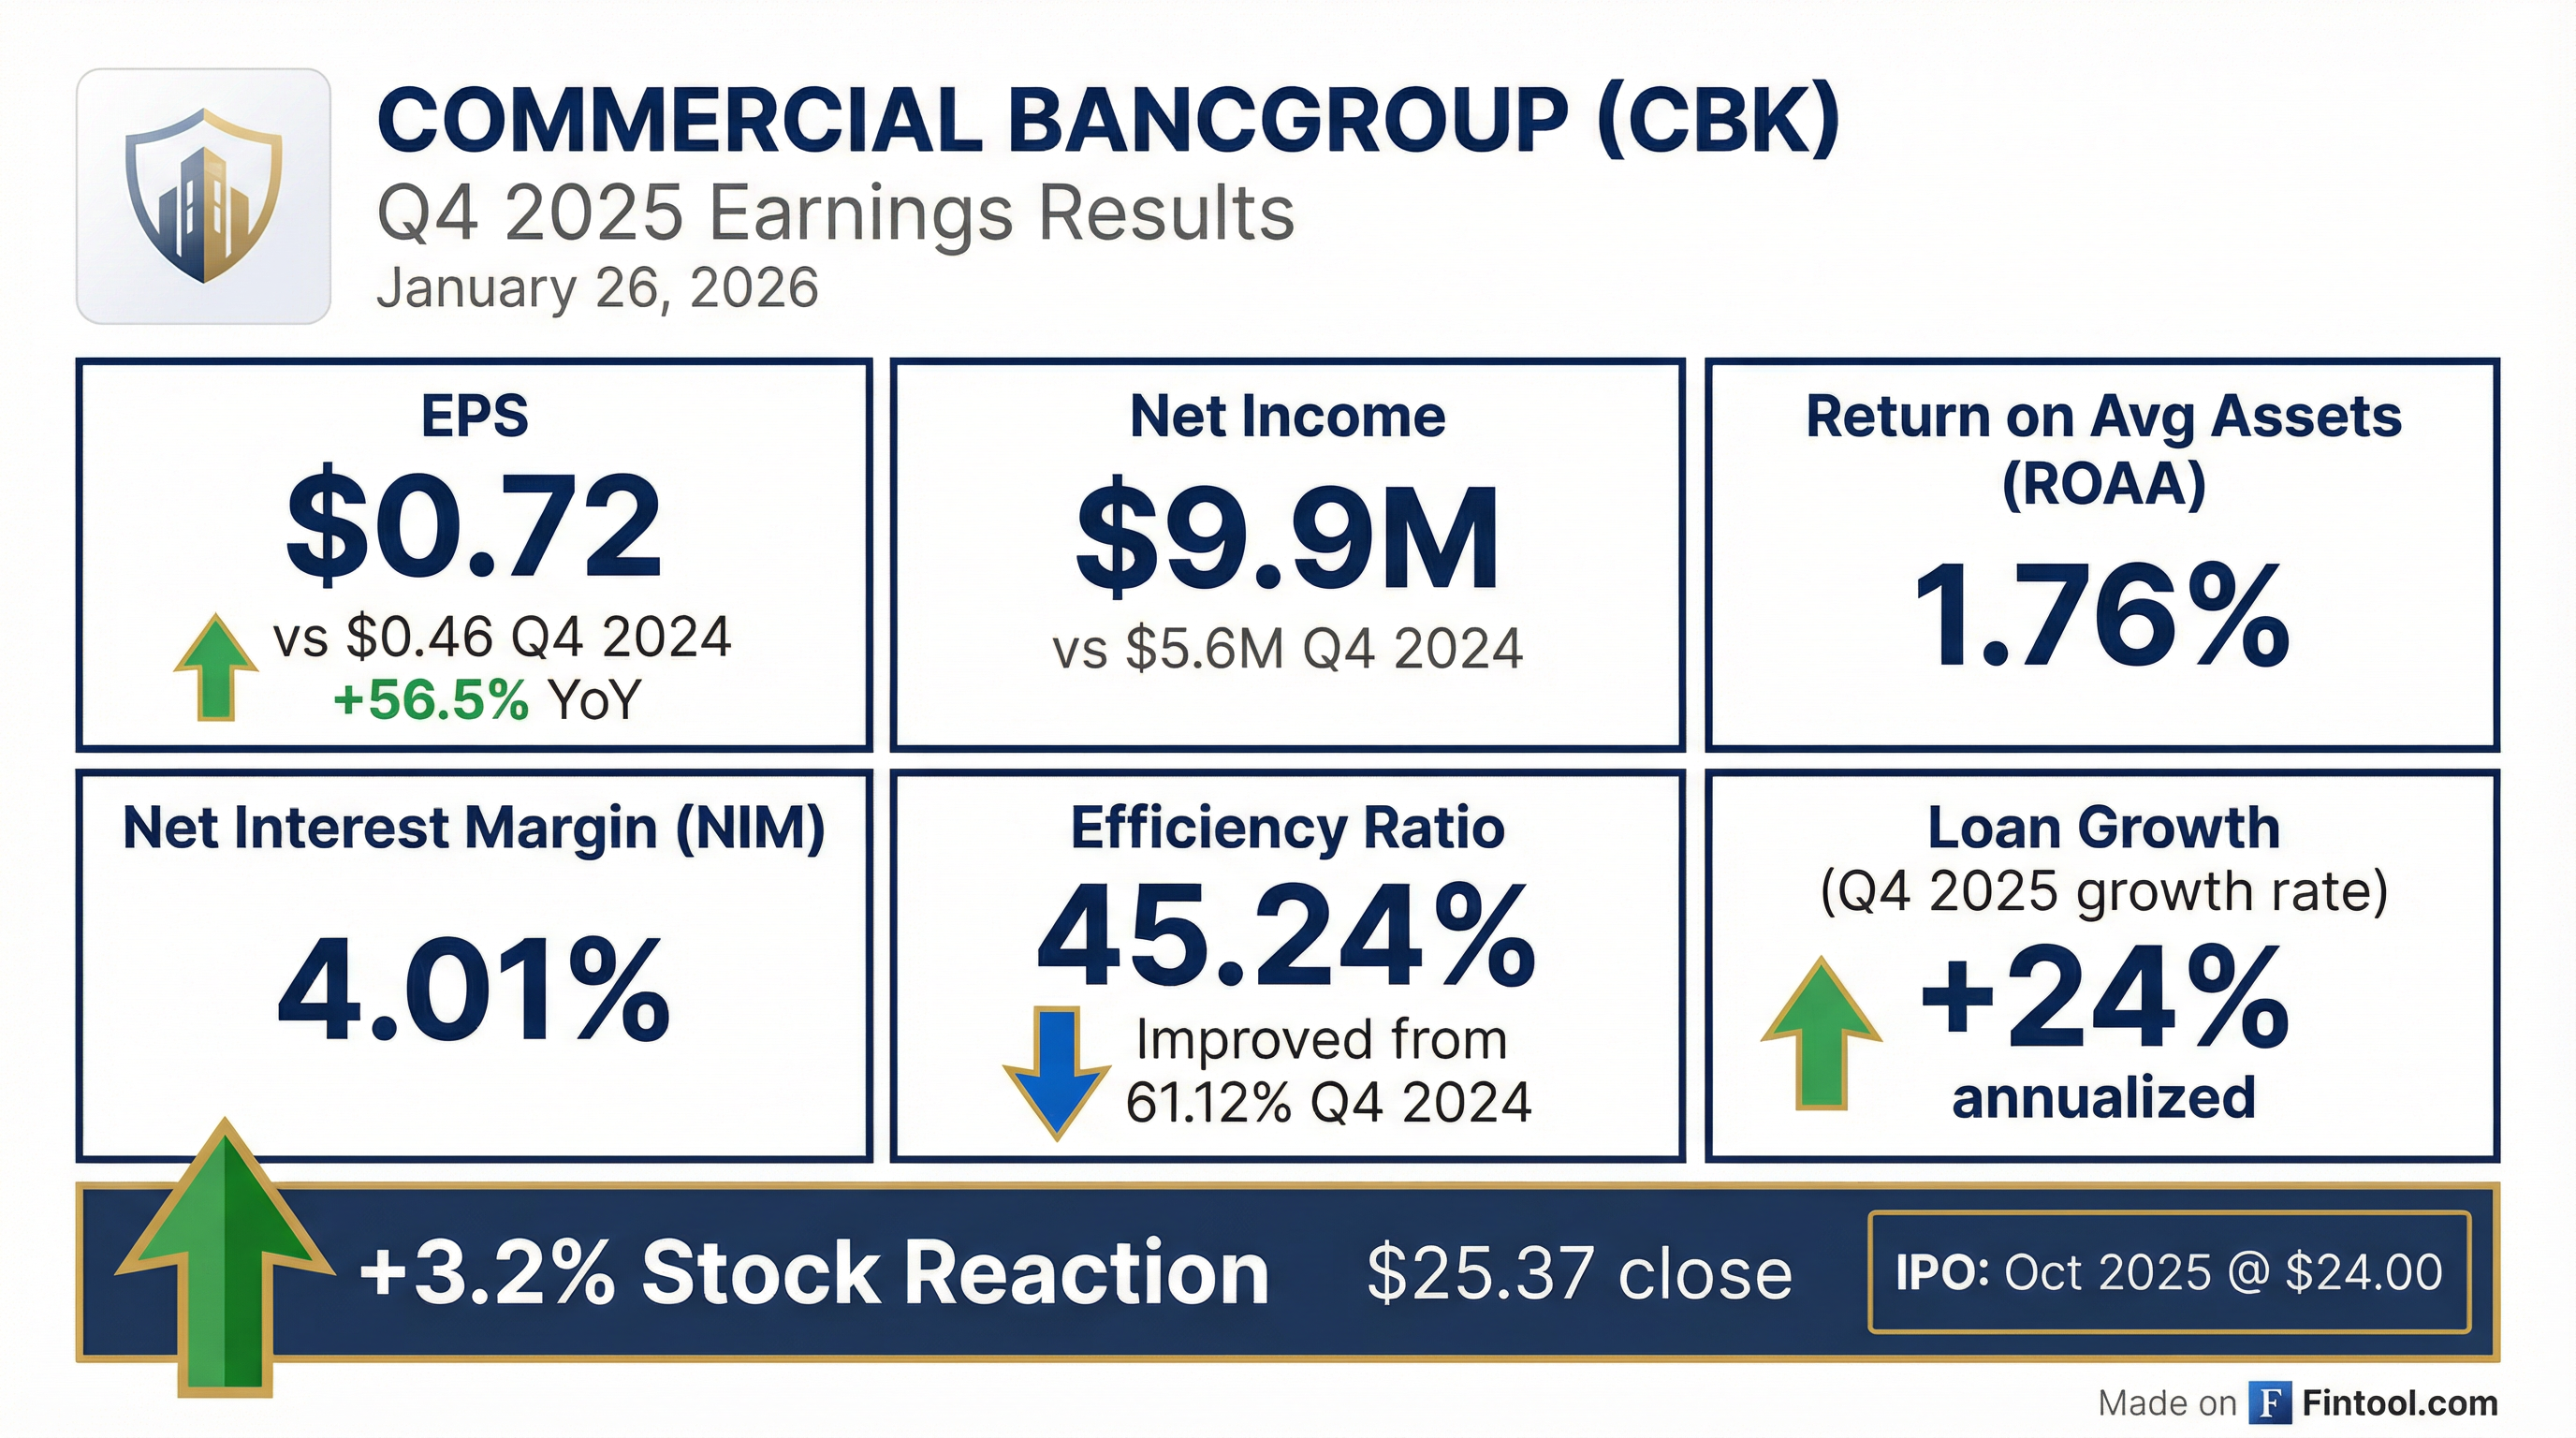
Commercial Bancgroup (NASDAQ: CBK) delivered a standout Q4 2025, with net income surging 77% YoY to $9.9 million ($0.72 diluted EPS) despite a modest miss versus consensus estimates. The Tennessee-based community bank, which IPO'd in October 2025, saw its stock rise 3.2% on earnings day as investors rewarded dramatic efficiency improvements and robust loan growth in the quarter.
The headline miss obscured what was a transformational quarter operationally: the efficiency ratio collapsed to 45.24% from 61.12% in Q4 2024, non-interest expense fell 24% YoY, and gross loans grew $106 million (+24% annualized).
Did Commercial Bancgroup Beat Earnings?
Commercial Bancgroup missed analyst estimates on both EPS and revenue:
*Values retrieved from S&P Global
However, the YoY growth story dominated the narrative:
The dramatic improvement in profitability metrics was driven primarily by expense control—non-interest expense fell to $10.6 million from $13.9 million in Q4 2024, a 24% reduction.
How Did the Stock React?
CBK shares rose 3.2% on earnings day to close at $25.37, outperforming the broader regional bank index. The stock is now trading 5.7% above its October 2025 IPO price of $24.00.
The positive reaction despite the headline miss suggests investors are focused on the operational turnaround story and growth trajectory rather than a single quarter's consensus beat/miss.
What Changed From Last Quarter?
Efficiency Transformation
The most striking change was the efficiency ratio improvement:
The Q4 2024 figure was inflated by merger-related expenses from the ABT Financial acquisition. Excluding those, the company has sustained a ~46-47% efficiency ratio through 2025.
Loan Growth Accelerated
After three quarters of relatively flat loan balances, Q4 saw a surge:
The $106 million Q4 loan increase represented 24% annualized growth, reversing the prior trend. Commercial real estate loans drove much of the growth, increasing to $1.11 billion from $1.00 billion in Q3.
Loan Portfolio Mix (December 31, 2025):
- Commercial Real Estate: 59%
- Residential: 20%
- Construction & Land Development: 10%
- Commercial (C&I): 9%
- Consumer/Other: 2%
The portfolio is 61% adjustable-rate and 39% fixed-rate, positioning the bank to benefit from the higher rate environment. Within non-owner occupied CRE, retail properties comprise 74% of the portfolio, with credit tenants covering debt service and no speculative loans.
Capital Strengthening Post-IPO
The October IPO transformed the capital structure:
Additionally, the company redeemed $20.3 million of holding company debt in October 2025 and $6.2 million of Trust Preferred Securities in January 2026, further cleaning up the capital structure.
Full Year 2025 Performance
Core earnings per share (excluding merger expenses) reached $2.96 for the full year, up from $2.75 in 2024.
Six-Year Performance Track Record
The Q4 results cap an impressive multi-year transformation. Since 2020, Commercial Bancgroup has delivered consistent growth across all key metrics:
Core EPS has nearly tripled over five years, while tangible book value per share has more than doubled. The efficiency ratio improved from 66% in 2020 to 47% in 2025.
Net Interest Margin Stable
Despite the Fed rate cuts in late 2025, Commercial Bancgroup maintained net interest margin:
The cost of funds declined from 2.31% in Q4 2024 to 1.88% in Q4 2025, more than offsetting any asset yield compression. The company reduced brokered deposits by $127 million during 2025 to just $48 million, lowering funding costs.
The deposit franchise is 50% checking accounts (23% noninterest-bearing, 28% interest-bearing demand), providing a low-cost funding base. By customer segment, deposits are split between public entities (47%), consumers (46%), and commercial accounts (7%).
Asset Quality Remains Strong
Credit quality metrics showed minimal deterioration:
The provision for credit losses was $150,000 in Q4 2025 versus $6,000 in Q4 2024, a modest increase but still de minimis relative to loan balances.
The loan portfolio is 99.1% "Pass" rated with only 0.56% "Special Mention" and 0.34% "Substandard."
Book Value Growth
Tangible book value per share growth has been a highlight:
TBVPS increased 16.7% YoY, from $17.11 to $19.96. At the current stock price of $25.37, shares trade at 1.27x tangible book value.
Looking Ahead
Market Positioning in High-Growth Southeast
Commercial Bancgroup is strategically positioned in four of the fastest-growing MSAs in the Southeast, all outpacing national population growth:
The loan portfolio is geographically diversified across these markets: Nashville MSA (25%), Knoxville MSA (15%), Charlotte MSA (13%), and Tri-Cities MSA (12%), with community markets comprising the remaining 35%.
Strategic Priorities
Commercial Bancgroup outlined several growth initiatives:
- Expansion into higher-growth markets in Tennessee, North Carolina, South Carolina, and North Georgia
- Focus on small and medium-sized businesses in the Charlotte, Nashville, and Knoxville MSAs
- De novo expansion with planned new branch locations
- Disciplined M&A targeting family-controlled community banks with emphasis on balance sheet retention
The company noted there are 49 banks with assets between $500M and $2B in Tennessee, and approximately 75% of all banks in the state have less than $1B in assets. CBK is one of only three major exchange-traded banks with total assets between $1.5B and $5.0B headquartered in Tennessee, North Carolina, or Kentucky—positioning it as a potential consolidator.
Key Metrics to Watch
- Loan growth sustainability: Can the Q4 momentum (+24% annualized) continue?
- NIM trajectory: Cost of funds declined, but how will asset yields hold up?
- M&A activity: Management has signaled interest in acquisitions
- Charlotte market traction: The ABT acquisition expanded footprint into this high-growth MSA
The Bottom Line
Commercial Bancgroup's Q4 2025 results represent a story of operational excellence overshadowing a modest consensus miss. The 45% efficiency ratio, 4% NIM, and 1.76% ROAA are top-tier metrics for a community bank. The IPO-related capital raise provides ample capacity for growth and potential M&A.
At 1.27x tangible book value and 8.7x trailing earnings, valuation appears reasonable for a high-performing community bank in growing Southeastern markets. The key question is whether the Q4 loan growth acceleration signals the start of a new growth phase or simply reflects timing of large transactions.
For more on Commercial Bancgroup, visit the company research page or read the full Q4 2025 earnings transcript.